The general idea is that you want to maximize return and minimize risk. That is, you want that $50,000 to generate the most amount of money each year as possible, with the least amount of risk as possible.
In finance, we call this the “Sharpe Ratio” after William Sharpe. This ratio is:
Expected return divided by the standard deviation of that return squared
Don’t worry about what this means for now — just know that there are smart people who have put a lot of thought into this question.
You may have heard about “diversification” as being important for investors. Think about it this way:
- Say you pick a random 5-year old and see how much he grows over the next year. Say he grows 4 inches.
- Next year, you pick another random 5-year old. This one grows 2 inches.
- You do this again the following year, and that one grows 6 inches.
Now, assume you do this instead:
- You pick a group of 1,000 kids who are all 5-years old and see how much they all grow on average. Say, on average, they grow 4 inches.
- Next year, you pick a different group of 1,000 kids. They grow 4.1 inches.
- The following year’s group grows 3.9 inches.
You would expect that the variation in “average growth of 1,000 kids” will be much smaller than the variation of the growth of doing it one kid at a time. In other words, the “standard deviation” of an average of a group is smaller than the “standard deviation” of single entity.
In statistics, you learn about how “standard deviation goes down as sample size increases”. This is the same idea.
The same thing happens with companies. As a whole, the economy grows each year. Some companies grow a lot, some go bankrupt, but on average they’re growing.
So, would you rather take that $50,000 and invest it in a single company? Or, would you rather split it up and invest in many companies instead? The latter is a much better option.
Let’s look at an example
Say you take your $50,000 and invest it in a company with a return of 10% per year. Great, right? So, after one year you get $5,000 from that company, right?
Not really. That 10% is an “expected rate of return” — it’s never guaranteed and always different than the 10%. That “10% per year” comes with risk, or “standard deviation.”
The risk is typically expressed as volatility, or “how far off from the 10% is the actual return each year”?
Let’s pretend like Amigos Lemonade had these returns:
- Year 1: 11%
- Year 2: 9%
- Year 3: 12%
- Year 4: 8%
You calculate the average return as ( 11% + 9% + 12% + 8% ) divided by the 4 years. This equals to 10%. So, if nothing changes, you should be OK using that 10% as your estimate for what Amigos Lemonade will return next year.
But, you know that it won’t be exactly 10%. How do you determine the range of possible outcomes? How do you know if you can assume it your return will be between 9–11%? Or is it a wider possible range, more like 4–16%?
One way of figuring this out is by using standard deviation. Standard deviation simply means we take the actual returns in the past and subtract it from the average to get the difference each year. We “square” and “take the square root” to get rid of negative signs.
Side reading: Read about “squaring” and “square roots”. It’s a simple trick to get rid of negative numbers.
We end up with something like this:
- Year 1: 11% minus 10% = 1%
- Year 2: 9% minus 10% = -1%
- Year 3: 12% minus 10% = 2%
- Year 4: 8% minus 10% = -2%
If we take the average of the differences above, we end up with 0%, because 1% + -1% + 2% — 2% = 0%. This doesn’t tell us anything about the real variance that exists here.
So, we square each one.
- Year 1: 11% minus 10% = 1% => Becomes simply 1. ¹² = 1
- Year 2: 9% minus 10% = -1% => Becomes -1. (-1)² = 1
- Year 3: 12% minus 10% = 2% => Becomes 2. ²² = 4
- Year 4: 8% minus 10% = -2% => Becomes -2. (-2)² = 4
We then add each number above to get 1 + 1 + 4 + 4 = 10, then divide that 10 by the number of data points minus 1 to get 10 divided by (4 minus 1) = 2.5. I’ll leave it to the reader to understand the “minus 1” part.
Because we squared the numbers above, we then take the square root of the 2.5 to get 1.6. So, our standard deviation is 1.6%.
This means that, on average, each year the amount we get back will be 10% “plus or minus” 1.6%.
What does “plus or minus” really mean? With what probability do we end up with a return somewhere between 10% minus 1.6% = 8.4% and 10% plus 1.6% = 11.6%? The answer is that there is a 68.2% probability our return ends up being somewhere 8.4% and 11.6%.
How do I know this?
It turns out that a lot of things in natural follow what’s called a “normal distribution.” I won’t cover that here, but I encourage you to watch some YouTube videos and read the Wikipedia article on it.
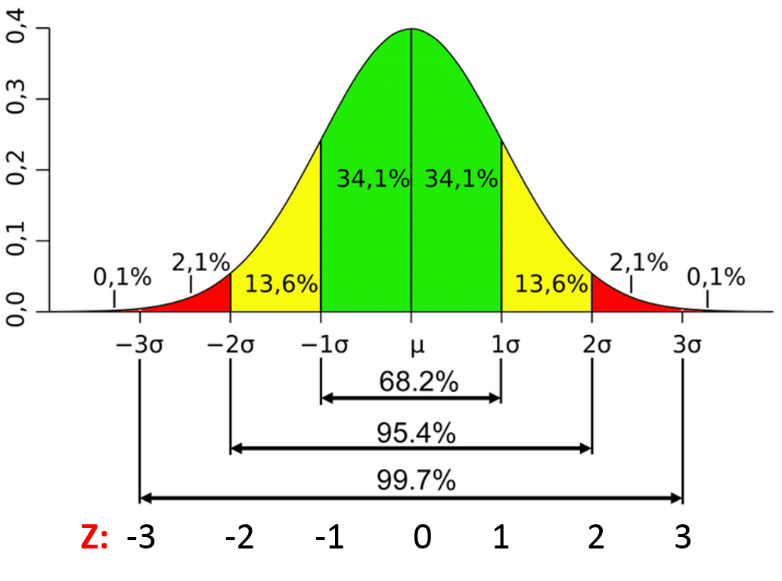
The graph below shows the “normal distribution curve.” It’ really simple to interpret.
The Y-axis on the left side represents the probability. The X-axis represents the “standard deviations”. The area under the curve represents the probability.
The symbol µ means “average”. In our case, µ is 10%. The symbol σ means “standard deviation”. So, 1σ means one standard deviation, and 2σ means two standard deviations. In our example, σ is 1.6%.
So, if you look at the graph below, -1σ would be 10% minus 1.6% = 8.4% and 1σ would be 10% plus 1.6% = 11.6%. You can see the area under the curve for the range between -1σ and 1σ is 34.1% + 34.1% = 68.2%. This means that we have a 68.2% probability that our return will be between 8.4% and 11.6%.
What’s the probability our return will be within a wider range? We have a 95.4% probability that our return will be somewhere between 10% minus 2 times 1.6% = 6.8% and 10% plus 2 times 1.6% = 13.2%. In other words, the area under the normal distribution curve for µ + 2σ and µ — 2σ is 95.4%.
Side comment: The normal distribution curve shows up everywhere. In fact, IQ tests are designed so that the average IQ is 100 and the standard deviation is 15. This means that 68.2% of the population has an IQ between 85 and 115, and 95.4% have an IQ between 70 and 130. It also means that 2.2% of the population has an IQ over 130, which is the area under the curve below to the right of 2σ, which is 2.1% + 0.1% = 2.2%. This same phenomenon happens with height, weight, and so on.
Another side note: In finance, there’s something called “idiosyncratic risk” and “systemic risk”. This refers to the risk associated with a single opportunity and the risk inherent in the economy as a whole, that you can’t remove from diversification. We won’t go into this here.
